“analySIS Five” Bonus Package
BONUS Package란 무료로 제공되는 기능으로서 ChartNav, mht (microhardness testing), roughness를 지원합니다. 단, analySIS Five imager 이상의 제품만 지원합니다. (imager, docu, auto, pro등급만 지원)

chartNav
specialized module for use in the metallography field
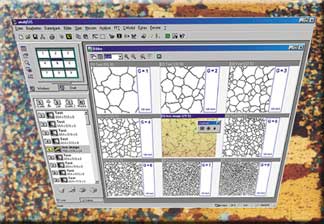
chartNav makes use of the analySIS® ViewPort Manager. This ViewPort Manager enables you to view several images simultaneously via multiple ViewPorts. This makes comparing a live image to reference images very easy – at a glance.
chartNav is operated via specific dialog boxes. A separate button bar allows you to switch back and forth between the 3×3 or 2×2 image configuration.
The alignment series required is selected from an extendable list. chartNav supports the creation of your own, and in principle, as-long-as-you-wish alignment series. Predefined norm series can be supplemented; user-defined alignment series created.
You can switch back and forth between a 2×2 or 3×3 image view. A green square represents live-image position (for the 3×3 view, this is in the center; for 2×2, at the upper-left). This square can be moved to the various lines and columns via mouse / keyboard. This is the way further images of the alignment series are displayed in ViewPorts. Lines and columns can be named as you like. You can also have the name of the norm series displayed.
Moreover, you can have the name of the current alignment series displayed and edit the line and column names. Each alignment series can be extended with a user-definable data sheet. Its lines contain the specific data of the respective reference images. This data can be transferred to a results sheet during an alignment-series comparison and used for classification of the object within the live image. The statistic functions within analySIS® provide additional evaluation options.
Once you’ve found the appropriate reference image, you can transfer its data from a user-definable source sheet to a list of results at the click of a button. A statistical evaluation of this classification provides further information. Images acquired and result sheets can be saved and managed in theanalySIS® integrated database.
| chartNav extensions: | description |
| Digital Chart DIN 50601 | Reference images of standard DIN 50601 for micrographic determination of the ferritic or austenitic grain size of steels and ferrous materials. |
| Digital Chart DIN 50602 | Reference images of standard DIN 50602 for the microscopic examination of special steels using standard diagrams to assess the content of non-metallic inclusions. |
| Digital Chart DIN EN ISO 945 | Reference images of standard DIN EN ISO 945 for the designation of microstructure of graphite inclusive. |
| Digital Chart ISO 643 | Reference images of standard ISO 643 for the micrographic determination of the ferritic or austenitic grain size. |
| Digital chart ASTM E 112 | Reference images of standard ASTM E 112 for the micrographic determination of the ferritic or austenitic grain size. |
Specifications
![]() excellent ergonomics through simultaneous image display
excellent ergonomics through simultaneous image display
![]() alignment-series comparison with live or saved images
alignment-series comparison with live or saved images
![]() easy to operate via the image matrix
easy to operate via the image matrix
![]() 3×3 or 2×2 image views
3×3 or 2×2 image views
![]() easy to select image series
easy to select image series
![]() unrestricted definition of own image series
unrestricted definition of own image series
![]() display of ID numbers
display of ID numbers
![]() easy classification via user-definable data sheets
easy classification via user-definable data sheets
![]() statistical and archiving functions
statistical and archiving functions
![]() integrated in analySIS® 3.0 and higher
integrated in analySIS® 3.0 and higher
mht (microhardness testing)
Analyzing microhardness indents quantitatively
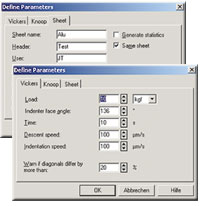
mht is the analySIS® module for determining microhardness according to Vickers and Knoop. mht supports ‘Reportlink’ so you can insert your measurement results into reportsfully automatically.
Results appear in a sheet which includes the measured and calculated values, including statistical evaluation.
mht also provides you with the option of reading out your device setting.
· ASTM A 247
· GB 9441-88
· …
Roughness Module
analySIS Five imager 이상의 제품에 기본적으로 사용이 가능한 Roughness 는 캡쳐된 화면의 정보를 이용하여 Roughness를 측정 합니다.
|
How to measure Roughness
|
||
| Roughness along a line | The results of a roughness measurement is given as a set of parameters and profiles, derived from a measurement of the surface of the specimen. This measurement is performed along a line. The traditional method for this Primary, Roughness, and Waviness 233 is leading a mechanical stylus across the surface of the specimen and tracking the height variation. The actual parameters and profiles are extracted and calculated from this measurement. With the roughness module you interactively perform the measurement on an image calibrated so that the image intensity corresponds to a height value. A “no dimension” approach is also supported. In case a dimension is required, the given parameters is noted as “NA”. |
|
| Roughness along a polyline |
Using the Roughness module in 1D, you may also measure the roughness along a polyline instead along a simple, straight line. The calculations used for determining the profiles are designed to correctly handle measurements along straight lines, though. This means that the roughness and waviness near the vertices of the polyline have to be used with caution. | |
| Roughness in a rectangular area |
The traditional approach of leading a mechanical stylus along a line across the surface, does not allow extending the method to two-dimensional measurements. Therefore, all roughness parameters are calculated rather than measured. For an explanation and the formulas used, refer to the chapter Measuring 2D Roughness. |
|
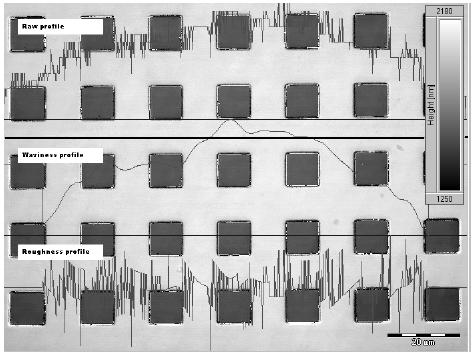
An example for three profiles for a Row displayed. the thick, black line is the one selected for the analysis.
The parts with a value of 0 in the waviness and roughness profiles are due to the setting of λc